
A ‘flagged’ result on your blood test report does not automatically mean something is seriously wrong; often, it’s just statistical noise.
- Your personal health trend over time is a far more powerful indicator than a single « abnormal » snapshot compared to a generic population average.
- Factors like how your blood was drawn, stored, and even your stress levels on the day can significantly influence the results.
Recommendation: Instead of focusing on individual out-of-range numbers, learn to track the trajectory of your key markers and use this article’s insights to have a more informed conversation with your doctor.
Receiving that notification that your lab results are ready can trigger a unique blend of anxiety and curiosity. You open the PDF, and there it is: a table of numbers, abbreviations, and—most unnervingly—bolded values marked as ‘High’ or ‘Low’. The immediate reflex for many is to turn to Dr. Google, a consultation that often leads down a rabbit hole of worst-case scenarios. You might have come here because a result like « low lymphocytes » has you concerned, and the standard advice to « talk to your doctor » feels insufficient when your appointment is weeks away.
The conventional approach to reading these reports is binary: is the number inside or outside the ‘normal’ reference range? This is a massive oversimplification. As a clinical hematologist, I can tell you that interpreting a Full Blood Count (FBC) is less like reading a scoreboard and more like analyzing a complex, dynamic weather map. The most common advice revolves around static lists of what could cause a high or low number, but this misses the crucial context.
But what if the key wasn’t the single, isolated number but the story it tells over time in the context of your unique physiology? What if you could learn to differentiate the true signals from the background noise? This guide is designed to shift your perspective. We won’t just list causes for abnormal results. Instead, we will equip you with a clinician’s mindset, helping you understand the principles of personal baselines, the impact of external factors, and the art of seeing the trend, not just the snapshot. This knowledge will empower you to have a much more productive and less anxious conversation with your healthcare provider.
To help you navigate this complex topic, this article is structured to build your understanding step by step. We will explore why your ‘normal’ is unique, how to spot potential issues with the test itself, and how to interpret your results in the broader context of your overall health.
Summary: A Clinician’s Guide to Your Bloodwork
- Why Your « Normal » Might Be Abnormal for Someone Else?
- How to Spot When Your Blood Sample Was Mishandled?
- Cholesterol Screening: Total, HDL, LDL, or Lipid Ratio?
- The Mildly Elevated Result That Triggers Unnecessary Biopsies
- How Often Should You Retest if Cholesterol Remains Borderline?
- IBS or Ovarian Cancer: Which Symptoms Should Alarm You?
- How to Use a Continuous Glucose Monitor Without Being Insulin Dependent?
- Managing Type 2 Diabetes Without Medication: Is It Possible?
Why Your « Normal » Might Be Abnormal for Someone Else?
The first concept to grasp is that the ‘normal’ reference ranges printed on your lab report are not absolute truths carved in stone. They are statistical averages derived from a large, diverse population. These ranges are designed to capture about 95% of a healthy population, but this means that, by definition, 5% of perfectly healthy individuals will have results that fall outside these limits. Your personal ‘normal’ can be quite different. As a clinician, I am far more interested in your personal baseline—the consistent range your body maintains when you are well.
A sudden shift from your own baseline, even if the new number is still within the ‘normal’ population range, is often more clinically significant than a stable number that has always been slightly outside the reference. Groundbreaking research published in Nature demonstrates that for many people, their ‘normal’ blood values fall within a narrow range — one that is much smaller than the population-based reference range. This underscores the power of tracking your own data over time.
This is why a single flagged result should be met with curiosity, not panic. As Healthdirect Australia, a government-funded health information service, aptly puts it in their patient guide:
If your results are higher or lower than what is considered normal for the general population, it doesn’t always mean there is a problem.
– Healthdirect Australia, Full blood count (FBC) patient guide
Think of the reference range as a general guideline for a highway’s speed limit, but your personal baseline is the specific speed at which your car runs most efficiently. A deviation from your car’s optimal performance is what truly warrants investigation, not just whether you are going faster or slower than the average driver.
How to Spot When Your Blood Sample Was Mishandled?
Before you even begin to worry about what a result means biologically, it’s crucial to consider the possibility of a pre-analytical error. This is a clinical term for anything that goes wrong with the sample *before* it even gets to the analysis machine. This « noise » can create a false signal, leading to unnecessary anxiety and follow-up tests. The journey of your blood from your vein to the lab is fraught with potential pitfalls: a difficult draw, improper tube mixing, or delays in transport can all alter the results.
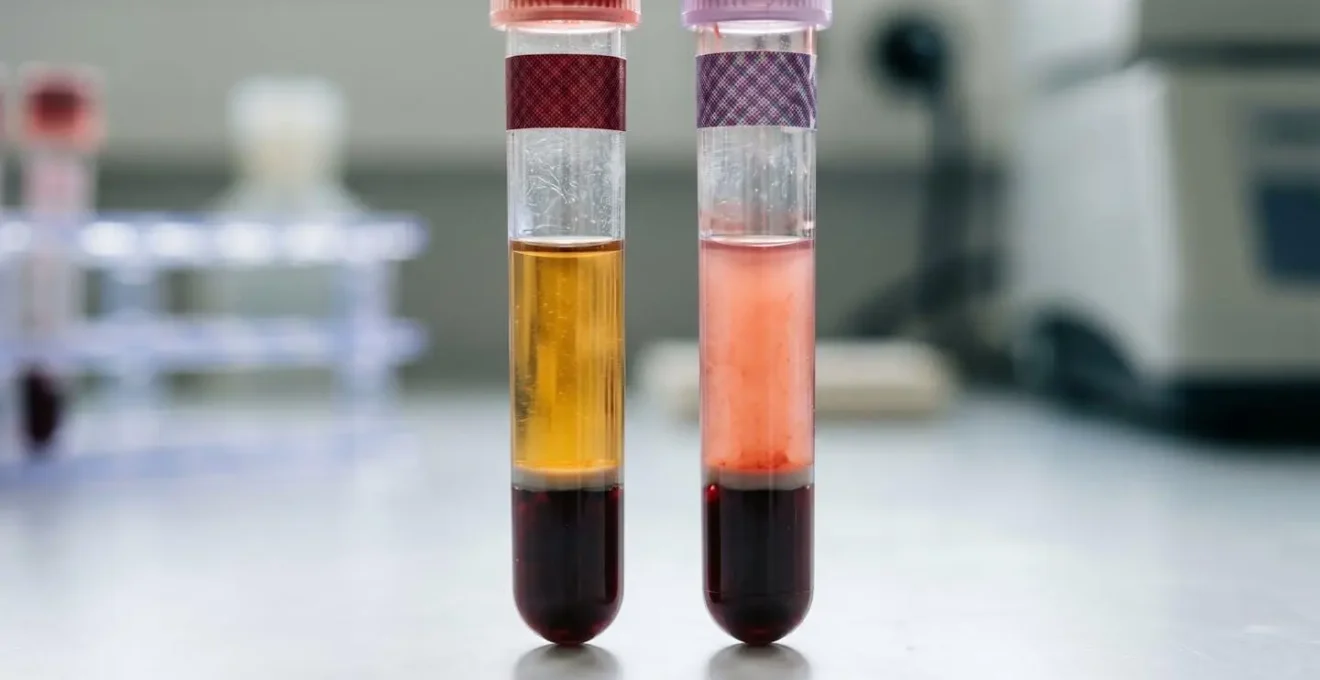
One of the most common issues is hemolysis, the bursting of red blood cells. This can falsely elevate certain markers, like potassium and LDH, and interfere with numerous other assays. Hemolysis can occur due to a challenging blood draw or rough handling of the sample. In fact, in vitro hemolysis accounts for 40–70% of unsuitable blood samples in laboratory settings, making it a significant source of error.
While you can’t see this process, a good lab will often flag a hemolyzed sample and may note it on the report or request a redraw. The visual difference is stark, as seen below, where the serum (the liquid part of the blood) turns from its normal straw color to pink or red.
Other issues, like a clotted sample (which can falsely lower your platelet count) or a sample that was not fasting when it should have been, are also common. The key takeaway is that an unexpected, isolated, and dramatically abnormal result in an otherwise healthy person should always raise the question: could this be a lab error? A simple retest is often the first and most logical step before embarking on an extensive diagnostic journey.
Cholesterol Screening: Total, HDL, LDL, or Lipid Ratio?
Just as we go beyond the ‘normal’ range for FBC, modern medicine is moving beyond the most basic markers for cardiovascular risk. For decades, the focus in cholesterol screening has been on Total Cholesterol, HDL (« good » cholesterol), and LDL (« bad » cholesterol). While these are useful, they don’t tell the whole story. This is another example of our theme: we must look for the more precise signal amidst the general noise.
The standard LDL-C measurement is often a calculation, not a direct measurement, and its accuracy can be affected by other factors, like high triglycerides. A more advanced and arguably more accurate marker for assessing cardiovascular risk is Apolipoprotein B (ApoB). Simply put, ApoB is the protein that sits on the surface of all the « bad » cholesterol particles. Every single LDL, VLDL, and other atherogenic (plaque-forming) particle has exactly one ApoB molecule on it. Therefore, measuring ApoB gives you a direct count of how many potentially dangerous particles are circulating in your bloodstream.
Two people could have the same calculated LDL-C, but one might have a few large, fluffy LDL particles, while the other has many small, dense, highly dangerous particles. The ApoB test would clearly differentiate these two, revealing the higher risk in the second person. Recognizing this, European guidelines have established clinical cut points. For instance, the 2019 European Society of Cardiology guidelines established that a high ApoB level, such as above 105 mg/dL, represents a significant percentile of the population and warrants attention. Asking for an ApoB test can provide a much clearer picture of your true risk than relying on the standard lipid panel alone.
This principle extends to other areas. Instead of just looking at triglycerides and HDL in isolation, the Triglyceride/HDL ratio has emerged as a powerful, simple indicator of insulin resistance. It provides more context than either number alone. The lesson here is to always ask if there is a more advanced or contextual marker that can refine your understanding.
The Mildly Elevated Result That Triggers Unnecessary Biopsies
One of the most anxiety-provoking situations for a patient is a mildly elevated result that leads to a recommendation for an invasive procedure, like a biopsy. This often stems from a statistical phenomenon called « regression to the mean. » In simple terms, if a variable is extreme on its first measurement, it will tend to be closer to the average on its second measurement. A slightly high liver enzyme or a mildly elevated tumor marker can easily be a random fluctuation—the « 1 in 20 » healthy person who falls outside the 95% reference range on any given day.
As the medical team at Morningside Medical notes, this is a statistical certainty:
Normal reference intervals capture 95% of a healthy population, so one in twenty healthy people will land slightly beyond the limits.
– Morningside Medical, Baseline Tests Guide
A reflexive decision to proceed with an invasive procedure without considering this phenomenon can lead to unnecessary risk, cost, and anxiety. The most prudent course of action is often « watchful waiting » with a plan to retest in a few weeks or months. If the value has returned to normal, it was likely just statistical noise. If it remains elevated or continues to rise, then the signal is stronger, and further investigation is more clearly warranted. Empowering yourself to be part of this decision-making process is crucial. Before agreeing to an invasive procedure based on a single, mildly abnormal lab value, consider having a structured conversation with your doctor.
Your Action Plan: Questions to Ask Before an Investigative Procedure
- What is the pre-test probability this is serious, given my specific context and symptoms?
- What are the risks of the procedure itself versus watchful waiting with retesting?
- If we re-test in 3 months and the value is stable, what would that tell us?
- Are my symptoms affecting my quality of life enough to warrant immediate investigation?
- Can we explore lifestyle measures or additional tests before an invasive procedure?
How Often Should You Retest if Cholesterol Remains Borderline?
The concept of « regression to the mean » leads directly to the next crucial strategy: understanding the power of trajectory. For a borderline result, particularly for something like cholesterol, the most important question is not « Is it high? » but « Where is it going? ». The frequency of retesting depends entirely on this trajectory and your overall risk profile. A single borderline result in a low-risk individual might warrant a recheck in a year or two. However, if there are other risk factors (family history, high blood pressure), a recheck in 3-6 months might be more appropriate.
The real insight comes from plotting these data points over time. This is where the « snapshot vs. trend » principle shines. As Dr. Candice Knight, a specialist in health optimization, explains, the trend is paramount:
A borderline result that has been stable for five years is far less concerning than a borderline result that has jumped 20% in one year, even if both are below the official ‘high’ threshold.
– Dr. Candice Knight, Hone Health optimal vs normal lab ranges
This highlights why keeping your own records or using a health app to track your results over years can be so valuable. You become the curator of your own health story. This long-term view allows you and your doctor to see the impact of lifestyle interventions—like changes in diet, exercise, or stress management—on your biochemistry in a concrete way.
So, how often to retest? It’s a personalized decision. If a result is borderline and you’ve initiated a new lifestyle change, retesting in 3 to 6 months can provide powerful biofeedback. If a result is stable and has been for years, less frequent testing is likely sufficient. The goal is to collect enough data points to establish a clear trendline for your key health markers, transforming a series of snapshots into a coherent narrative of your health journey.
IBS or Ovarian Cancer: Which Symptoms Should Alarm You?
Sometimes, the most valuable information from a Full Blood Count isn’t a flagged result, but the reassuring power of a completely normal one. This is particularly true when differentiating between conditions with overlapping, vague symptoms, a scenario that causes immense patient anxiety. A classic example is the overlap between Irritable Bowel Syndrome (IBS) and ovarian cancer. Both can present with bloating, abdominal discomfort, and changes in bowel habits.
This is where the FBC acts as a crucial, non-invasive sorting tool. While it cannot diagnose IBS, it can provide strong evidence against a more sinister underlying cause. Significant inflammatory processes or cancers often leave a footprint on the blood count. They might cause anemia (a low red blood cell count) due to chronic inflammation or microscopic bleeding, or they might cause a high platelet count (thrombocytosis) as part of the body’s inflammatory response. An elevated white blood cell count can also be a sign of a systemic issue.
Therefore, when a patient presents with symptoms like bloating but has a completely unremarkable FBC, it significantly lowers the clinical suspicion for cancer. As the educational resource Geeky Medics points out for clinicians-in-training:
A perfectly normal FBC (no anemia, normal platelets, normal WBC) in a patient with bloating strongly points away from cancer and towards a functional issue like IBS.
– Geeky Medics, Full Blood Count Interpretation Guide
This doesn’t mean the symptoms are « all in your head. » They are very real. But a normal FBC allows the clinical focus to shift confidently toward managing a functional disorder like IBS, rather than pursuing an exhaustive and invasive workup for cancer. In this context, a « normal » result is not just a lack of bad news; it is positive, actionable diagnostic information that helps guide the next steps.
How to Use a Continuous Glucose Monitor Without Being Insulin Dependent?
The final layer of sophisticated interpretation is understanding that your FBC doesn’t exist in a bubble. Its markers are influenced by, and in turn influence, other systems in your body—most notably, your metabolic health. The rise of Continuous Glucose Monitors (CGMs) among the general wellness community, not just those with diabetes, has provided a powerful new stream of data. Correlating this glucose data with your FBC can unlock profound insights into your overall health.
Chronic inflammation is a key driver of many diseases, and it leaves its mark on both glucose metabolism and the FBC. Large spikes and dips in blood sugar (high glycemic variability) are a form of metabolic stress that promotes inflammation. This inflammation can then be seen in the FBC through markers like a high Neutrophil-to-Lymphocyte Ratio (NLR), which is increasingly recognized as a potent indicator of systemic inflammation and stress.
A high NLR in the presence of high glycemic variability on a CGM paints a clear picture of inflammation-driven metabolic dysfunction. This context is critical. For instance, a doctor might see a slightly low red blood cell count (mild anemia) and reflexively recommend iron supplements. However, if the patient also has high glycemic variability and a high NLR, the anemia might actually be « anemia of chronic inflammation, » a condition where the body has plenty of iron but can’t use it properly due to inflammation. In this case, the root cause isn’t iron deficiency; it’s metabolic stress. The solution isn’t just an iron pill; it’s improving metabolic health.
Case Study: Linking CGM Data to FBC Inflammatory Markers
In a large study tracking metabolic health, researchers found a direct link between glucose patterns and blood markers. As detailed in a comprehensive analysis of NHANES data, individuals with high glycemic variability on continuous monitoring showed significantly elevated inflammatory markers, including higher neutrophil-to-lymphocyte ratios on their FBC tests. This correlation demonstrated how CGM data provides essential metabolic context, helping clinicians distinguish nutrition-driven issues from inflammation-driven ones when interpreting FBC results.
Key takeaways
- Your personal trend over time is the most important reference range; a single ‘flagged’ result is just one data point, not a diagnosis.
- Always consider the possibility of « noise »—lab errors, hemolysis, or simple statistical variation—before worrying about a single abnormal result.
- Context is everything: interpreting your FBC alongside advanced markers (like ApoB or CGM data) provides a much richer and more accurate picture of your health.
Managing Type 2 Diabetes Without Medication: Is It Possible?
The principles we’ve discussed—tracking trends, understanding metabolic context, and using advanced ratios—all culminate in the ultimate goal of proactive health management. For many conditions, including Type 2 Diabetes, this data-driven approach can empower individuals to make significant changes, potentially even achieving remission and managing the condition without medication. The key is to use bloodwork not as a passive diagnostic tool, but as an active biofeedback mechanism.
For example, the Triglyceride to HDL (TG/HDL) ratio we mentioned earlier is an incredibly powerful proxy for insulin resistance, the underlying driver of Type 2 Diabetes. It’s a simple calculation from a standard lipid panel, yet it provides profound insight. A systematic review of 32 studies involving 49,782 participants revealed that optimal cutoffs of 2.53 for women and 2.8 for men using the TG/HDL ratio were highly effective in detecting insulin resistance. Watching this ratio decrease over time is a concrete sign that your dietary and lifestyle interventions are successfully improving your body’s sensitivity to insulin.
Similarly, tracking FBC markers can provide feedback. As insulin sensitivity improves, systemic inflammation often decreases. This can be reflected in a lowering of the Neutrophil-to-Lymphocyte Ratio (NLR) and an improvement in Red Cell Distribution Width (RDW), a marker that reflects the uniformity of your red blood cells and is often elevated in inflammatory states. Presenting this trajectory of improving numbers—a falling TG/HDL ratio, a decreasing NLR, a normalizing RDW—to your physician provides objective evidence of physiological improvement. This data forms the foundation for a collaborative discussion about reducing or even discontinuing medication, a process known as de-prescribing.
While this journey must always be undertaken under strict medical supervision, it is absolutely possible. It transforms the patient from a passive recipient of care into the primary driver of their own health outcomes, using bloodwork as a roadmap and a motivator.
By learning to read the story in your bloodwork—the trends, the context, and the ratios—you can shift from a state of health anxiety to one of empowered self-management. The next time you receive your lab results, you’ll be equipped to have a more meaningful, data-driven conversation with your doctor to co-create your optimal health strategy.